B2B Sales
Top AI Tools for Sales Data Visualizations 2026
Mar 20, 2026
Compare top AI sales visualization tools that boost forecasting accuracy, integrate with CRMs, and deliver conversational, actionable dashboards.

Sales teams are drowning in data but need better tools to understand it. Traditional tools only show past performance, but AI-powered sales visualization tools analyze, predict, and recommend actions in real time. These tools help sales teams improve forecasting accuracy, prioritize deals, and increase revenue execution faster than competitors.
Key takeaways:
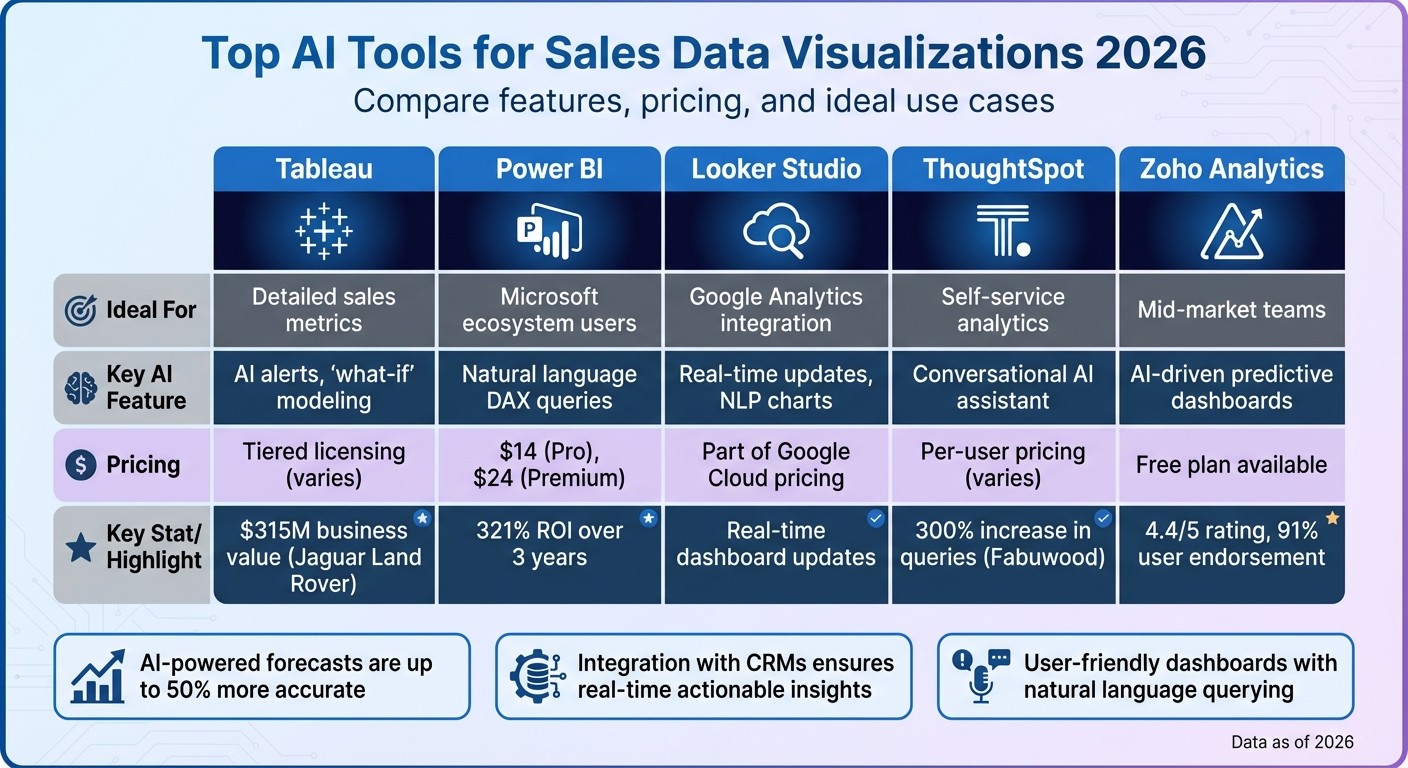
AI-powered forecasts are up to 50% more accurate, helping sales teams avoid missed revenue targets.
Integration with CRMs ensures real-time data and actionable insights directly in platforms like Salesforce or HubSpot.
User-friendly dashboards with natural language querying make insights accessible to all team members.
Here are the top tools for 2026:
Tableau: Advanced metrics, real-time alerts, and "what-if" scenario modeling.
Power BI: Seamless integration with Microsoft 365 and natural language AI features.
Looker Studio: Ideal for Google Analytics users, with conversational charts and real-time updates.
ThoughtSpot: AI assistant for conversational data exploration and self-service analytics.
Zoho Analytics: Affordable predictive analytics with anomaly detection and AI-driven dashboards.
Quick Comparison:
Tool | Ideal For | Key Feature | Pricing (per user/month) |
|---|---|---|---|
Tableau | Detailed sales metrics | AI alerts, "what-if" modeling | Tiered licensing (varies) |
Power BI | Microsoft ecosystem users | Natural language DAX queries | $14 (Pro), $24 (Premium) |
Looker Studio | Google Analytics integration | Real-time updates, NLP charts | Part of Google Cloud pricing |
ThoughtSpot | Self-service analytics | Conversational AI assistant | Per-user pricing (varies) |
Zoho Analytics | Mid-market teams | AI-driven predictive dashboards | Free plan available |
These tools empower sales teams to act on data faster and more effectively while reducing manual work.
Top 5 AI Sales Visualization Tools Comparison 2026
Let Excel AI and Power BI Visualize Your Data - Smart Sales Mapping
What to Look for in AI Sales Visualization Tools
AI sales visualization tools can vary widely in their ability to predict outcomes, integrate seamlessly with existing systems, and provide an intuitive user experience. These three factors often determine whether a tool becomes an essential part of your sales process or ends up gathering dust. This shift is a core component of the future of sales enablement, where AI-driven insights become the standard.
AI-Powered Predictive Sales Forecasting
The most effective AI tools go beyond static reporting, uncovering patterns that manual analysis often misses. For example, AI can analyze behavioral signals like email response rates, meeting frequency, stakeholder involvement, and historical win patterns to create a detailed probability map of potential outcomes[4]. This approach isn't just about convenience - it’s about results. AI-driven forecasts are often 20% to 50% more accurate than manual methods, with some models achieving up to 95% accuracy[4].
Look for tools that proactively flag at-risk deals before they derail your quarter. Advanced platforms also offer "what-if" scenario modeling, helping you visualize how changes - like a large deal slipping or a shift in conversion rates - might impact your forecast[3]. This feature is particularly crucial when over 55% of sales leaders cite inaccurate forecasting as a reason for missing revenue targets[4]. However, even the most advanced forecasting tools are only as good as the data they can access, making integration a key consideration.
Integration with Your Sales Tech Stack
For AI visualization tools to deliver meaningful insights, they need access to accurate, real-time data. The best tools offer bi-directional integration with your CRM, not just pulling data but also feeding back AI-generated insights, risk scores, and actionable steps directly into the system where your team operates[6][5]. Native integrations with platforms like Salesforce, HubSpot, Zoom, and email systems eliminate the need for manual data entry, ensuring that dashboards reflect live pipeline activity. This can save sales reps 20% to 30% of their time spent on CRM updates[4].
It's worth noting that 63% of Salesforce Einstein forecasting implementations fail due to inaccurate CRM data[7]. To avoid this, prioritize tools with native connectors over third-party integrations to minimize latency and reduce maintenance issues[6]. Once the data is accurate and accessible, the next step is ensuring your team can easily interpret it.
Simple Dashboards for Sales Teams
The usability of a tool often determines its adoption. Modern AI tools now include natural language querying (NLQ), allowing managers to ask straightforward questions like "Why did our Q1 close rate drop?" without needing technical expertise in SQL or data analysis[2][8]. This conversational interface makes exploring complex data as simple as a quick search.
Dashboards should also be tailored to specific roles. For instance, a sales rep might need a quick overview of their daily pipeline and next steps, while a VP might require high-level forecasts and team performance metrics. Customizable dashboards ensure that everyone gets the information they need, in the format they prefer. Tools like ThoughtSpot and Tableau even allow users to inspect the calculation logic behind visualizations, helping build trust in the data and reducing the risk of relying on misleading insights[2].
Top AI Tools for Sales Data Visualizations in 2026
These AI tools are revolutionizing how sales teams process and understand data. By blending deep CRM integration with intuitive interfaces, they turn raw numbers into meaningful insights. Here's how some of the leading platforms and a structured B2B sales playbook can enhance your decision-making.
Tableau for Advanced Sales Metrics Analysis
Tableau has integrated AI-driven tools like Tableau Pulse for custom KPI tracking and Tableau Agent, which automates data visualization and root cause analysis[10]. With Tableau Agent's "Concierge" skill, users can create visualizations using simple prompts and uncover problem areas without manual data preparation[10].
Salesforce used Tableau's "Forecast Walkup" dashboards to empower 85% of its sales teams in 2025–2026. These dashboards let account executives explore "what-if" scenarios and receive AI-powered alerts directly in Slack, freeing them to focus on selling instead of data entry[12]. Courtney House, VP of Sales Analytics at Salesforce, highlights Tableau's impact:
"Tableau is the tool that gives users the ability to ask questions about the data they're seeing and solve business problems faster."[12]
Another notable success: Jaguar Land Rover generated $315M in business value using Tableau's analytics platform[15]. With a tiered licensing system - Creator, Explorer, and Viewer - advanced AI features like Tableau Pulse are available in Tableau Cloud[12][13]. Additionally, lead engagement data refreshes every 30 minutes, helping sales teams prioritize opportunities in near real-time[12].
Power BI for Microsoft Ecosystem Users
For companies already invested in Microsoft 365, Power BI is a natural fit. Its Copilot feature simplifies report creation, generates DAX calculations using natural language, and provides text-based summaries of complex data[9]. Seamless integration with Microsoft 365 eliminates the hassle of data transfers and has delivered a 321% ROI over three years[9].
Power BI earned the top spot for "Ability to Execute" in Gartner's June 2024 Magic Quadrant for Analytics and BI Platforms[9]. Pricing starts at $14.00 per user/month for Power BI Pro (billed annually) and $24.00 per user/month for Power BI Premium Per User. Advanced AI features require Premium or Fabric licenses[9]. While Excel users will find the interface familiar, mastering DAX is necessary for creating custom visuals[13]. This mix of user-friendly design and AI-powered automation ensures teams can quickly act on their data.
Looker Studio for Google Analytics Sales Insights

Looker Studio is ideal for teams leveraging Google's ecosystem. It excels at visualizing data from Google Ads and Analytics, offering real-time dashboard updates and Gemini-powered conversational charts[14]. This makes it particularly useful for tracking digital marketing performance and web-based lead generation. Its semantic layer ensures natural language queries align with consistent business definitions, making insights both accurate and actionable[14]. By connecting seamlessly to Google's data sources, Looker Studio saves time and helps sales teams pinpoint which campaigns generate the most qualified leads.
ThoughtSpot for Conversational Data Exploration
ThoughtSpot's Spotter AI assistant empowers sales teams to access insights without technical expertise. Instead of waiting for analysts, users can ask natural language questions and instantly receive "Liveboards", which are interactive dashboards[11][13]. This conversational approach boosts analytics adoption and query volume.
For example, Fabuwood saw a 300% increase in queries and a 2.5× rise in executive analytics usage after adopting ThoughtSpot[13]. Similarly, Matillion reduced reporting ticket requests by 80% after switching from Tableau to ThoughtSpot, giving users more control over their data[13].
ThoughtSpot uses a per-user pricing model and maintains a 4.5/5 rating. Its live connection to cloud data warehouses ensures real-time insights[11][13]. Craig Haughan, VP of Data Engineering & Architecture at CWT, praises the platform:
"Spotter introduces limitless conversational experiences, supercharging our customers' self-serve capabilities - so they are never more than a question away from insights."[11]
This self-service model eliminates delays, allowing faster, data-driven decisions.
Zoho Analytics for Scalable Predictive Analytics
Zoho Analytics stands out for mid-market teams looking for predictive insights. Its Zia AI assistant can create dashboards and flag anomalies or forecasts with just one prompt[16].
Connor Nobert, Director of Analytics and Technology at Pulse LLC, shares his experience:
"Zoho Analytics gives us a superior edge over Power BI and Tableau, when it comes to the aesthetics of visualization. We're very happy with Zoho's capability."[16]
With a 4.4/5 rating and recognition as a Leader in Gartner's 2025 Magic Quadrant for Analytics and BI Platforms, Zoho Analytics is endorsed by 91% of users for its business value and forecasting abilities[16]. The platform offers a free plan for basic features and is known for its affordability. Automated data syncing, which can update hourly or daily, ensures dashboards reflect the latest pipeline activity, enabling sales teams to stay ahead of the curve.
How Coach Pilot Works with Sales Visualization Tools

Visualization tools like Tableau and Power BI are great at showcasing pipeline metrics - things like risk scores, deal velocity, and conversion rates. But here’s the catch: they don’t tell you what to do next. That’s where Coach Pilot steps in. It bridges this gap by embedding actionable sales playbooks right into your workflow. For instance, if your dashboard shows a deal is stalling, Coach Pilot doesn’t just highlight the problem - it tells you exactly what to do. It might suggest which stakeholder to contact and even provide messaging based on what’s worked in similar situations.
Coach Pilot also takes the hassle out of manual CRM updates by automatically capturing deal data. This automation frees up reps, saving them an average of 19.5 hours per week. Take Connor Bell, a BDM at HubSpot, as an example. In June 2024, he used Coach Pilot to generate 50% more net new opportunities, close 12 new deals in just 11 weeks, and drive a 38% increase in quarterly sales revenue[17].
The platform doesn’t stop at saving time - it helps you uncover the winning strategies of top performers. By analyzing complex engagement patterns and procurement tactics, Coach Pilot boosts forecast accuracy. Just look at Rebecca Veksler, Co-Founder of Four Rooms. In May 2024, she tripled her monthly sales and closed 14 new deals in just 8 weeks by leveraging the platform’s insights[17].
Integration is another key strength. Coach Pilot works natively with Microsoft Copilot, Microsoft Teams, and ChatGPT for Teams, making it a seamless addition to your tech stack. Unlike conversation intelligence tools that might only flag competitor mentions during a call, Coach Pilot goes further. It provides specific next steps, like suggesting, “Email the CFO by Thursday with this message.”
The results speak for themselves: customers have reported 7.8x pipeline growth in under 90 days and a 39% increase in quota attainment by swapping generic outreach for AI-guided messaging[17].
If you’re still relying on static PDF playbooks, it’s time for an upgrade. Coach Pilot transforms those outdated documents into dynamic, AI-driven workflows. By leveraging proven deal patterns, it turns insights from visualization tools into consistent revenue growth[17].
Choosing the Right AI Visualization Tool for Your Sales Team
When it comes to picking the best AI visualization tool for your sales team, careful evaluation is key. The wrong choice can lead to unreliable data and wasted resources. Did you know that 67% of AI implementations fail due to messy CRM data? [5] That’s why it’s crucial to ensure the tool you select integrates seamlessly with your CRM. Before committing, test it with real pipeline data to confirm metrics like churn rate are calculated accurately [2].
Ease of use is another major factor. If your sales reps need technical skills like SQL just to create basic reports, you’re adding unnecessary hurdles. In fact, 71% of business intelligence users report losing too much time configuring charts [18]. A tool with natural language processing can simplify this process. For instance, it should handle follow-up queries like “show me just Q4” without requiring users to start from scratch.
Transparency is equally important. Trustworthy insights are the backbone of faster revenue growth, but only if you can verify their accuracy. Look for tools with "explainable AI" features that reveal the logic or SQL behind each chart. Without this, you risk acting on flawed data. For example, a tool might incorrectly calculate churn by using invoice dates instead of cancellation dates, throwing off your entire forecast [2].
Mobility and pricing are also considerations. Real-time mobile dashboards can empower field reps to close deals on the go. On the pricing front, watch out for hidden costs. Some platforms charge per AI action - like $0.10 for every chart generated or field updated - making monthly bills unpredictable [5]. To avoid surprises, request a full cost breakdown that includes implementation, platform fees, and usage charges.
Lastly, speed matters. 56% of early adopters of AI-powered analytics have already surpassed their business goals by acting on insights at the right time [1]. Long setup times (think 8–12 weeks) can slow down your momentum. Newer AI-native tools, however, can get you up and running in just 2–3 days [5], so you can start making data-driven decisions almost immediately.
FAQs
What data do I need for accurate AI sales forecasts?
To make AI-driven sales forecasts more precise, you'll need to gather a mix of key inputs: historical sales data, pipeline activity, deal behaviors, market signals, and operational constraints. These elements allow AI tools to identify trends, anticipate results, and deliver insights you can act on to sharpen your forecasting.
How do I check if an AI dashboard’s insights are trustworthy?
To trust the insights from an AI dashboard, it's important to assess how it manages definitions, calculations, and transparency. Make sure it aligns with your business logic, KPIs, and data governance standards. Features like clear reasoning, access to the underlying data, and audit trails can make a big difference in ensuring reliability. And keep this in mind: speed is not the same as accuracy. The real value lies in transparency and sticking to your established metrics.
What hidden costs should I watch for in AI visualization tools?
When working with AI visualization tools, keep an eye on potential hidden costs. These might include data migration fees, the expense of retraining your team, dependence on specific platforms, infrastructure costs, and even overage charges for data or intelligence usage. These expenses can pile up quickly, so it’s crucial to assess the complete range of costs before committing to any tool.
Related Blog Posts

Remove the guesswork from winning more deals.
