B2B Sales
How Interactive Dashboards Improve Sales Productivity
Apr 24, 2026
Use interactive, real-time sales dashboards with AI insights and filters to spot stalled deals, prioritize actions, and improve productivity.

Interactive dashboards transform sales data into actionable insights, helping teams focus on what drives results. They provide real-time updates, customizable views, and AI-driven tools to monitor key metrics like revenue, pipeline health, and conversion rates. By replacing static reports with dynamic visuals, sales teams can quickly identify stalled deals, prioritize high-impact activities, and make informed decisions.
Key takeaways:
Real-time data ensures timely actions on leads and opportunities.
Customizable metrics like win rates, pipeline velocity, and activity levels help teams stay on target.
AI tools suggest next steps and flag risks before deals fall through.
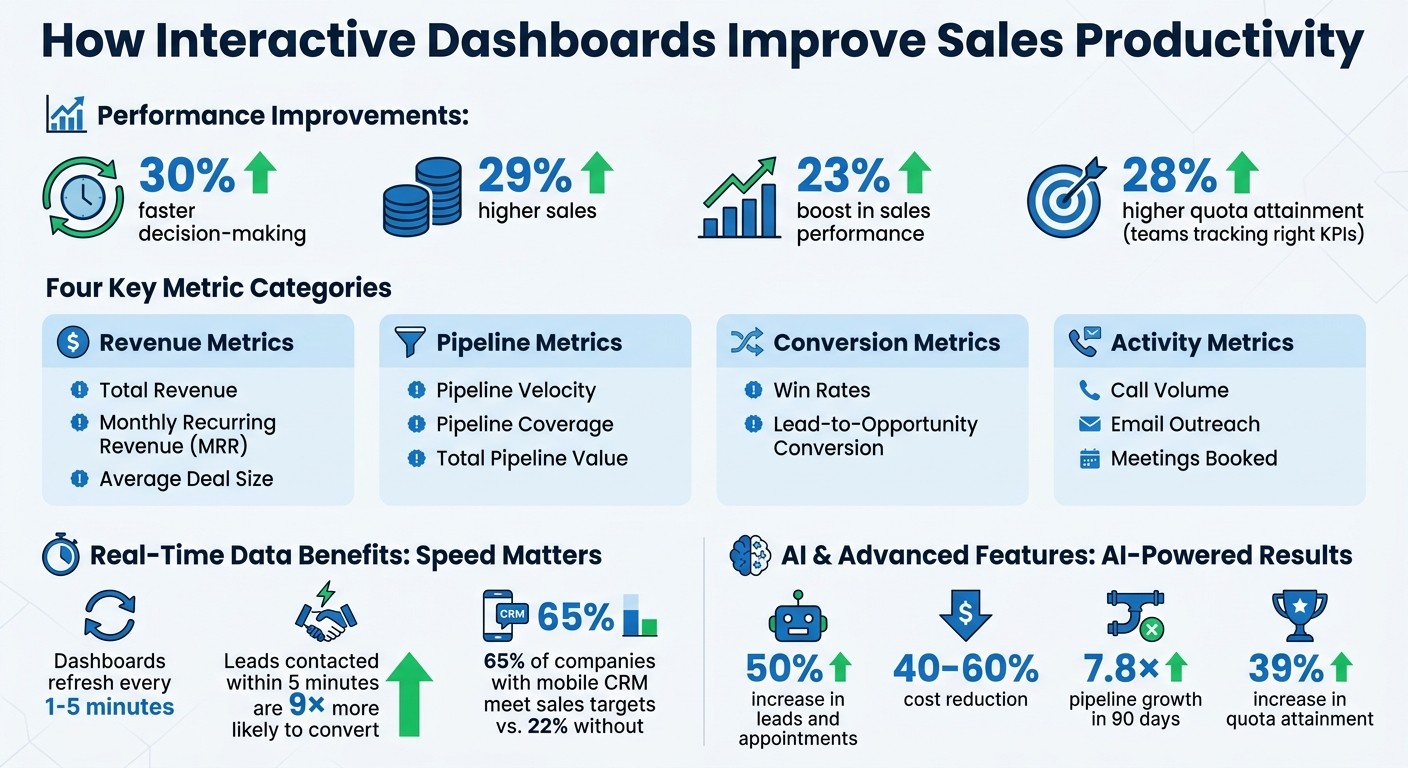
Companies using dashboards report up to 30% faster decision-making and 29% higher sales.
Interactive dashboards are not just data tools - they're decision-making aids that streamline workflows and boost productivity.
How Interactive Sales Dashboards Boost Productivity: Key Statistics and Metrics
Sales Dashboard in 30 Minutes | DAX KPIs + Interactive Filters
Tracking Key Sales Metrics
Interactive dashboards are game-changers for sales teams, offering a quick snapshot of essential metrics like total revenue, Monthly Recurring Revenue (MRR), pipeline value, win rates, and conversion rates - all in one place [7][10]. This centralized view helps reps and managers answer pressing questions like, "Are we on track to hit our goals?" or "Where are deals stalling?" without wasting precious selling time. Below, we’ll break down the most critical metrics and how real-time updates can drive smarter, faster decisions.
Focusing on the right metrics is what sets high-performing teams apart. In fact, teams that track the right Key Performance Indicators (KPIs) achieve 28% higher quota attainment compared to those that don’t [10]. The trick is to balance lagging indicators, such as closed revenue, with leading indicators like call volume, emails sent, and meetings booked [9][10]. Lagging metrics show past performance, while leading metrics offer early warnings about potential issues. For example, if a rep’s activity levels drop mid-week, a smart dashboard will flag it immediately, allowing managers to step in before it impacts the month’s results. These real-time insights turn raw data into actionable strategies, helping teams identify trends and fine-tune their workflows.
Metrics to Monitor
The most effective dashboards focus on four key areas: revenue, pipeline, conversion efficiency, and activity. Here’s a closer look:
Revenue Metrics: These include total revenue, MRR, and average deal size, which provide a clear picture of outcomes [7][10].
Pipeline Metrics: Pipeline velocity (how quickly deals progress), pipeline coverage (pipeline value relative to quota), and total pipeline value help forecast future success [7][9].
Conversion Metrics: Win rates and lead-to-opportunity conversion rates highlight where prospects are getting stuck and evaluate the overall sales process [7][9].
Activity Metrics: Tracking call volume, email outreach, and meetings booked helps distinguish between low effort and ineffective techniques. If reps aren’t hitting their numbers, managers can determine whether the issue lies in activity levels or sales strategies [9][10].
A great dashboard follows the "5-second rule" - users should be able to understand the key takeaway ("Are we on track?") within five seconds [8][7]. Features like color coding (green for on target, yellow for needs attention, red for off track) make it even easier to assess performance at a glance [7][10].
Real-Time Data for Quick Decisions
Real-time updates are essential for making timely decisions. Unlike outdated reports that rely on manual exports or static CSV files, modern dashboards refresh every 1–5 minutes. This ensures that decisions are based on the most current pipeline data, not old information from last week [9][11]. This immediacy matters - leads contacted within 5 minutes are nine times more likely to convert than those reached later [10]. Real-time alerts allow teams to act on hot leads without delay.
The benefits extend beyond individual deals. For example, in 2026, Meritt used real-time tracking and cleaned CRM data to triple its pipeline to $300,000 per week. They achieved this by slashing their email bounce rate from 35% to under 4% [11]. Real-time data also helps managers address bottlenecks, like deals stalling in the proposal stage, by stepping in with targeted coaching before opportunities slip away [9][12]. Plus, companies using mobile CRM dashboards are 65% more likely to meet sales targets compared to just 22% for those without mobile access [12].
Identifying Trends Through Interactive Features
Interactive dashboards go beyond simply presenting data - they help uncover trends that lead to smarter decisions. For example, companies using sales analytics dashboards report a 23% boost in sales performance [14]. Unlike static reports, these dashboards allow sales teams to explore "what if" scenarios, helping them identify the future of sales enablement strategies for faster deal closures or pinpointing high-performing territories. By combining real-time tracking with deeper insights, these tools empower teams to make more informed decisions.
Using Filters to Spot Trends
Filters are a powerful way to reveal patterns that might otherwise go unnoticed. By narrowing data by region, sales rep, product line, time period, or lead source, teams can identify trends and make proactive adjustments. For instance, filtering by region or time period can highlight high-performing territories or seasonal fluctuations, enabling teams to act ahead of time [2][4][13].
Lead-source filtering is another game-changer. It shows which marketing channels bring in the best prospects. For example, if webinar attendees convert at twice the rate of cold outreach leads, it’s a clear sign to reallocate resources [3][12]. Ka Ling Wu, Co-Founder & CEO of Upsolve AI, highlights the value of this approach:
"Instead of just showing plain reports, [interactive dashboards] let you click, explore, and understand your data in a simple way - all in real time" [13].
By isolating variables - like comparing performance across territories or product lines - teams can uncover what top performers are doing differently and use those insights to guide others [2][3].
Drill-Down Features for Deeper Insights
Drill-down functionality takes analysis to the next level. It allows users to move from a broad overview to specific details. For instance, if total revenue drops in a given month, managers can drill into specific regions, then further into individual reps or product categories, to find the root cause [1][5]. This helps identify whether the issue stems from low activity, poor targeting, or product-related challenges.
GoodData emphasizes the value of this feature:
"Drill-down lets users move from broad summaries into granular data (such as performance by rep, region, or product). It helps diagnose issues and uncover opportunities" [4].
Teams that leverage drill-down features to track metrics like sales velocity often see 23% faster revenue growth compared to those focusing solely on pipeline value [15]. This functionality keeps dashboards clean and uncluttered while offering the flexibility to investigate anomalies without needing to switch tools or export data [5][15].
Optimizing Sales Workflows
To truly refine sales workflows, leveraging real-time metrics is just the beginning. The key lies in identifying stalled deals and understanding the impact of specific activities. Interactive dashboards play a crucial role in turning raw data into actionable strategies. By combining precise metric tracking with instant alerts, these dashboards help sales teams stay on top of their goals. For example, tracking metrics like Pipeline Aging (how long deals stay in each stage) and Deal Slippage (deals that regress or fall out of the pipeline) eliminates blind spots and ensures no opportunity slips through the cracks [5][9].
Finding Bottlenecks and Stalled Deals
Dashboards are essential for diagnosing inefficiencies in the sales process. Metrics like Stage Conversion Rate and Average Time in Stage allow managers to identify where prospects are most likely to drop off [9]. For instance, if deals consistently stall at a specific stage, it signals the need for deeper analysis and timely intervention. Modern dashboards equipped with AI take this a step further by flagging risks. They analyze call recordings and email interactions to detect potential issues, such as pricing objections or waning engagement, before deals stagnate [6].
Integrations with tools like Slack amplify these capabilities. Automated slippage alerts notify teams the moment a deal regresses, enabling immediate action rather than discovering the issue weeks too late [5][16]. Once bottlenecks are identified, teams can zero in on activities that yield the best results.
Prioritizing High-Impact Activities
Not all sales activities are created equal, and dashboards help teams focus on what truly matters by tracking activity-to-outcome ratios [9][12]. For example, monitoring email velocity often provides a more accurate prediction of deal closure than call volume [18]. Tools like Predictive Deal Scoring take it further by analyzing factors like engagement frequency and stakeholder involvement to rank deals based on their likelihood to close [9][12]. This helps sales reps prioritize efforts on high-potential opportunities.
Organizations that use AI for prioritization have seen impressive results, including up to a 50% increase in leads and appointments while reducing costs by 40% to 60% [17]. Some advanced dashboards even suggest Next Best Actions, such as the ideal follow-up timing or which stakeholders to engage, based on patterns from previously successful deals [9][12]. By focusing on these insights, sales teams can maximize efficiency and drive better outcomes.
Using Coach Pilot to Enhance Dashboard Performance

Interactive dashboards are great for spotting performance trends, but Coach Pilot takes it a step further. By blending AI coaching with custom sales playbooks, it turns raw data into practical strategies that sales teams can act on right away. Coach Pilot bridges the gap between analytics and action, helping teams translate dashboard insights into real-world sales success.
Custom Sales Playbooks and Training
Coach Pilot offers tailored playbooks that sync seamlessly with dashboard data. Sales reps can pin roles, goals, KPIs, and live opportunities, ensuring that the AI coaching they receive is specific to their current deals - not just generic advice [20].
Winning strategies and effective objection responses are stored in a searchable format, making them instantly accessible through AI agents [20]. Coach Pilot even refers to its playbook as "the operating system" for executing sales strategies [21].
The platform also simplifies data entry by automatically recording deal information, ensuring dashboards stay accurate and up-to-date [21]. This automation saves sales reps an average of 19.5 hours per week on administrative tasks [19]. For instance, in June 2024, a HubSpot manager boosted net opportunities by 50% and closed 12 new deals within just 11 weeks using Coach Pilot’s tools [20].
While these custom playbooks provide a strong strategic foundation, the AI coaching ensures teams adapt and improve with every interaction.
AI Coaching for Real-Time Performance Improvements
Coach Pilot’s Performance Insights Dashboard gives managers a clear view of which reps are actively engaging with AI coaching and which AI agents are delivering the best results [20]. The platform includes six specialized AI coaches, covering areas like prospecting, discovery, and negotiation, to provide around-the-clock guidance throughout the sales cycle [20].
According to the Coach Pilot FAQ:
"Coach Pilot tells your reps what to do next. 'Email the CFO by Thursday with this message. Call the economic buyer Friday at 9am. Use these talking points that closed three similar deals'" [19].
The results speak for themselves. Teams using Coach Pilot have reported 7.8× pipeline growth within the first 90 days and a 39% increase in quota attainment [19]. In May 2024, Rebecca Veksler, Co-Founder of Four Rooms, achieved remarkable success - tripling monthly sales and closing 14 new deals in just 8 weeks by leveraging Coach Pilot’s strategies [20].
Best Practices for Using Interactive Dashboards
A dashboard is only effective if it’s tailored to meet the needs of your team. The following practices build on earlier strategies to improve decision-making and simplify sales workflows.
Start with Core KPIs
Less is more. Trying to track too many metrics can overwhelm your team and lead to analysis paralysis. Research shows that teams focusing on 5–7 key performance indicators (KPIs) achieve an average quota attainment of 91%, compared to just 73% for teams monitoring fewer than three metrics [10]. For smaller teams (fewer than 10 reps), focus on these five critical KPIs: Revenue Growth Rate, Win Rate, Sales Cycle Length, Pipeline Coverage, and Quota Attainment [10].
Make sure every metric directly supports your business objectives. A well-rounded dashboard includes both lagging indicators (like revenue and churn) and leading indicators (such as pipeline velocity and activity levels) to help you stay proactive [22]. Use color-coded thresholds to make insights instantly clear - green for hitting or exceeding 100% of the target, yellow for 80–99%, and red for anything below 80% [22].
Connect to Real-Time Data Sources
Outdated data erodes trust in your dashboard. In fact, 84% of data and analytics leaders agree that the quality of AI and analytics outputs depends entirely on the data they’re built on [11].
To keep your dashboard reliable, set up direct API connections to your CRM instead of relying on manual updates like CSV imports. For operational dashboards, aim for refresh intervals of 1–5 minutes, while executive dashboards can update every 10–15 minutes [11]. Clean data is just as important as real-time updates - regularly audit your CRM to fix duplicates, fill in missing fields, and remove outdated contacts. Tools like data enrichment services can improve pipeline accuracy and reduce email bounce rates.
Use Filters for Custom Views
Dashboards are more effective when they show the right data to the right people. By using filters and role-specific views, you can ensure team members aren’t overwhelmed by irrelevant information. Add interactive widgets that let users click on charts to explore specific deal details or uncover deeper insights [23][14].
Tailor dashboards to match each role’s needs: executives benefit from high-level metrics like revenue growth and gross margin, while sales managers need actionable data like pipeline coverage and win rates [22][9]. Revisit and adjust filters and KPIs quarterly to keep your dashboard aligned with evolving sales goals and quotas [23].
Conclusion
Interactive dashboards turn raw data into actionable insights, giving sales teams the clarity they need to monitor performance, identify trends, and fix workflow issues. With real-time data on metrics like pipeline health, quota attainment, and deal velocity, teams can replace guesswork with informed decision-making. The ability to zoom in from broad overviews to detailed specifics - like underperforming regions or top-performing products - elevates dashboards from simple reporting tools to essential strategy guides.
Incorporating a sales dashboard into a CRM system can result in an average 29% increase in sales [12]. Additionally, organizations that streamlined their metrics saw a 30% improvement in decision-making efficiency [7]. The challenge, however, isn’t just about having data - it’s about how effectively teams use it.
Platforms like Coach Pilot take this a step further by connecting data to actionable strategies. By integrating features like custom sales playbooks, interactive training, and AI-powered coaching, the platform helps teams translate insights into results. Instead of just reflecting on past performance, AI tools can assess deal health and buyer engagement to suggest the next best steps - turning dashboards into proactive coaching tools.
To make the most of these benefits, start by zeroing in on key KPIs and tailoring your dashboard to display real-time data. Use filters to create role-specific views, ensuring everyone stays focused on their priorities. When your dashboard serves as a unified source of truth that aligns executives, managers, and sales reps, you’ll spend less time searching for answers and more time closing deals.
Dashboards that deliver actionable insights don’t just report the past - they help shape the future.
FAQs
Which KPIs should our sales dashboard show first?
Your sales dashboard needs to focus on key metrics such as deal progress through pipeline stages, overall sales performance, and target achievement. These figures offer real-time visibility into your team's activities and results, enabling you to make timely decisions and improve workflows effectively.
How do we keep dashboard data accurate and up to date?
To keep dashboards accurate and up-to-date, rely on automatic refresh mechanisms. For operational data, aim for refresh intervals of 1-5 minutes, while executive summaries can be updated every 10-15 minutes. Avoid the pitfalls of manual updates or using outdated files, as these can compromise the reliability of your insights.
Another key factor is ensuring the data in your source systems, like CRMs, is clean. Errors or inaccuracies at the source can result in misleading metrics on your dashboard. Make it a habit to regularly review and validate data inputs, and consider setting up alerts for anomalies. These steps will help maintain the accuracy and dependability of your dashboards.
How can dashboards help us spot stalled deals faster?
Dashboards offer real-time insights into the status of deals and the overall pipeline. With this visibility, sales teams can quickly spot delays or bottlenecks. This means they can act fast to address issues, ensuring smoother processes and keeping deals on track - all while boosting overall sales efficiency.
Related Blog Posts

Remove the guesswork from winning more deals.
