B2B Sales
5 Ways Historical Data Boosts Forecast Accuracy
Mar 2, 2026
Five practical methods—time series, run-rate, consumption-based, regression, and calibration—show how clean historical data boosts sales forecast accuracy.

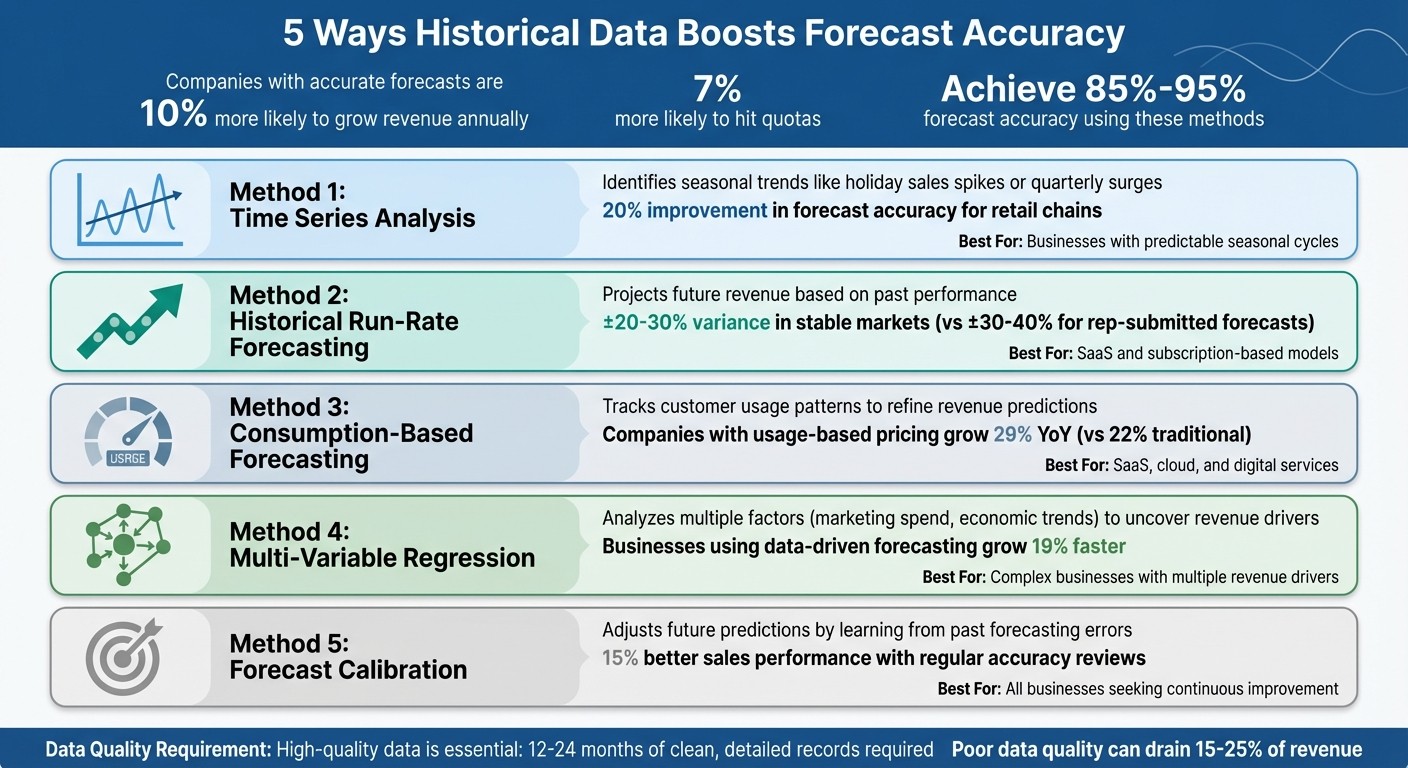
Using historical data is the key to accurate sales forecasting. Without it, businesses risk overestimating pipelines, misallocating resources, and missing revenue targets. Companies with accurate forecasts are 10% more likely to grow revenue annually and 7% more likely to hit quotas. This article outlines five effective methods to turn past performance into reliable predictions:
Time Series Analysis: Identifies seasonal trends like holiday sales spikes or quarterly surges.
Historical Run-Rate Forecasting: Projects future revenue based on past performance, ideal for stable environments.
Consumption-Based Forecasting: Tracks customer usage patterns to refine revenue predictions for subscription models.
Multi-Variable Regression: Analyzes multiple factors, like marketing spend and economic trends, to uncover revenue drivers.
Forecast Calibration: Adjusts future predictions by learning from past forecasting errors.
High-quality data is essential. Clean, detailed records improve accuracy and prevent costly mistakes. Businesses using these methods can achieve 85%-95% forecast accuracy, driving better decisions and consistent growth.
5 Historical Data Methods to Improve Sales Forecast Accuracy
5 Ways to Use Historical Data in Your Financial Model
How Historical Data Improves Forecasting
Historical data transforms guessing into informed decision-making by highlighting recurring patterns - like holiday sales spikes or end-of-quarter surges - that directly influence revenue projections [1]. Analyzing multiple years of data establishes a reliable baseline for identifying growth trends, which serves as the starting point for more focused analysis.
By diving deeper into these trends, segmenting historical data by factors like product, region, or customer group reveals the driving forces behind growth. This segmentation allows for sharper, more precise forecasts [1].
Historical data also plays a crucial role in identifying anomalies - those unusual changes caused by one-off events that are unlikely to repeat [11]. For instance, Atlassian enhanced its forecast accuracy from 65% to 87% in just two quarters by addressing data anomalies, such as missing amounts, incorrect close dates, and outdated opportunities. This effort also shaved 12 days off its sales cycle [15].
However, clean data is non-negotiable. Poor-quality data can drain 15%–25% of revenue [10] and significantly reduce the accuracy of forecasting models [9]. To account for seasonal cycles effectively, sales teams need 12–24 months of well-scrubbed, standardized data [2]. High-quality data is the backbone of reliable forecasting. In fact, organizations using CRM-based forecasts see a 37% boost in accuracy when they eliminate inactive deals and enforce mandatory deal fields [12][10].
1. Time Series Analysis for Seasonal Patterns
Time series analysis is a powerful tool for breaking down historical sales data to uncover seasonal trends. By separating data into four components - trend, seasonal, cyclical, and irregular - it becomes easier to identify recurring patterns, like the retail surge in Q4 or year-end budget spending in enterprise software. This approach helps distinguish genuine seasonal trends from random anomalies, forming a foundation for accurate forecasting strategies[16][18].
Applicability to Specific Business Models
Seasonal models are especially useful for businesses with predictable cycles. For example, Walmart uses these models to forecast demand for items like swimsuits in summer and coats in winter, ensuring they maintain the right inventory levels[19]. Similarly, FedEx relies on Holt-Winters exponential smoothing to predict package volumes during the holiday season[19]. In the B2B SaaS world, these models can help track patterns in renewals, churn, and quarter-end spending. Meanwhile, product-led growth companies with shorter sales cycles benefit from analyzing aggregated historical trends to refine their strategies[1][16][18]. These insights are part of a larger push toward data-driven forecasting, which improves revenue predictability.
Impact on Forecast Accuracy
A global retail chain that analyzed seasonal trends saw a 20% improvement in forecast accuracy, leading to better inventory management and reduced overstocking[1]. For businesses with pronounced seasonal patterns, the SARIMA (Seasonal Autoregressive Integrated Moving Average) model is highly effective, while ARIMA is better suited for trend-focused data[5][16]. Companies that adopt time series forecasting techniques tend to grow 19% faster compared to those relying solely on intuition[16]. This level of precision helps replace guesswork with reliable, data-backed predictions.
Reliability of Historical Data
To identify accurate seasonal patterns, you need 24–36 months (2–3 years) of data[16]. Interestingly, 62% of forecasting errors are attributed to poor data quality rather than flaws in the forecasting models themselves. This highlights the importance of thoroughly auditing historical records to remove anomalies before diving into analysis[16][17].
Ease of Implementation and Scalability
For simpler needs, tools like Excel’s "Forecast Sheet" or the FORECAST.ETS() function can handle seasonal data analysis effectively[17]. For more complex scenarios, segmenting forecasts - such as using separate models for self-serve versus enterprise sales - can capture different seasonal cycles[13]. Advanced AI-driven time series models can even adjust for seasonality in real time, uncovering subtle correlations that might otherwise go unnoticed[1][18]. Platforms like Coach Pilot integrate these advanced techniques, helping sales teams refine their forecasts and align execution with strategy. These scalable solutions make it easier to adapt and continuously improve forecasting processes.
2. Historical Run-Rate Forecasting
Historical run-rate forecasting uses past performance as a foundation to project future revenue, relying on actual historical data instead of subjective predictions. This method is especially useful for subscription-based or usage-driven models that depend on recurring contracts[2].
Applicability to Specific Business Models
This forecasting approach shines in stable and predictable environments. For SaaS companies, it helps estimate renewals and expansions over 4–12 quarters. Retail and e-commerce businesses can use it to predict quarterly trends, holiday peaks, and annual budget cycles by leveraging 12–24 months of historical data[2][7]. However, it’s less effective for businesses undergoing rapid market changes or introducing entirely new products, as it assumes that future trends will align closely with past performance[2].
Impact on Forecast Accuracy
In steady markets, historical run-rate forecasting tends to deliver a variance of ±20–30%, making it more reliable than rep-submitted forecasts, which can vary by ±30–40% due to factors like optimism bias or intentional underestimation (sandbagging)[20]. It also acts as a reality check. For instance, if a pipeline-based forecast predicts 50% growth but historical trends show a maximum of 20%, that mismatch signals the need for further analysis[20].
Ease of Implementation and Scalability
This method is relatively easy to implement and serves as a quick, effective baseline. It doesn’t automatically adjust for significant changes, such as new product launches or market disruptions[2]. The process is straightforward since it uses existing data from CRM or ERP systems, requiring no advanced statistical expertise[2][20]. However, it’s essential to clean your historical data to remove anomalies like one-off bulk orders[14].
As your business scales, consider segmenting forecasts by product line, region, or customer demographic instead of relying on a single aggregate figure[1]. Use the run-rate as your baseline, and then layer in adjustments for expected changes, such as new campaigns, pricing strategies, or product launches[2]. Tools like Coach Pilot can help sales teams integrate these practices into their workflows, aligning day-to-day execution with strategic goals to improve accuracy and drive consistent revenue growth through modern sales enablement strategies.
Up next, we’ll dive into how consumption-based forecasting can refine revenue predictions for subscription models.
3. Consumption-Based Forecasting for Subscription Models
Consumption-based forecasting relies on customers' actual product usage - not just contract values or sales pipelines - to predict future revenue. With 60% of companies experimenting with or adopting this model, usage metrics provide key insights into baseline activity, growth patterns, usage trends, and typical post-launch ramp-up periods[21].
Applicability to Specific Business Models
This approach is particularly effective for SaaS, cloud, and digital services companies where revenue fluctuates monthly based on real customer usage[21]. If your business charges for things like API calls, compute hours, data storage, transactions, or active seats - either as part of or in addition to a base subscription fee - consumption-based forecasting captures revenue dynamics that traditional methods often overlook[25]. In fact, companies with usage-based pricing models grow 29% year-over-year, compared to 22% for those sticking with traditional pricing structures[26]. However, this variability demands forecasting models that can handle non-linear growth patterns[22]. By focusing on actual usage, businesses can achieve a much clearer and more accurate revenue forecast.
Impact on Forecast Accuracy
Historical usage data acts as an early warning system, flagging declining usage as a potential churn risk and identifying surges as expansion opportunities[21]. Advanced forecasting models like ARIMA or FBProphet can reduce error rates to below 2% when predicting subscription volume and Monthly Recurring Revenue (MRR)[24]. Leading companies using usage-based models maintain a Mean Absolute Percentage Error (MAPE) of 15% or less for 90-day forecasts, while the industry average lags at 25-30%[26]. Even simple optimizations, like removing outliers from historical data, can improve MAPE by 50% for some businesses[24].
Ease of Implementation and Scalability
To implement consumption-based forecasting, integrate usage metrics from billing systems, product telemetry, or data warehouses directly into your CRM. This ensures your forecasts are grounded in real-time data[27][1]. Begin by forecasting at the account level instead of relying on company-wide averages, which can mask individual risks or growth opportunities[21][23]. Segment customers by factors like tier, industry, region, or onboarding stage to avoid "blended averages" that obscure critical behavioral differences[21]. Weekly updates to forecasts are essential in high-variability environments, as consumption patterns shift faster than fixed subscription models[22]. Static spreadsheets won't keep up - automated systems or AI-driven tools are necessary for real-time updates[23][27]. Tools like Coach Pilot can help sales teams align these consumption insights with their workflows, translating improved forecast accuracy into better pipeline management and stronger revenue execution.
4. Multi-Variable Regression Analysis
Multi-variable regression analysis takes forecasting to the next level by analyzing how multiple factors interact to influence sales outcomes. Instead of focusing on just one variable, this method examines the combined effects of elements like marketing spend, economic trends, seasonality, competitor actions, and more. The real strength of this approach lies in its ability to quantify specific relationships. For example, it can reveal exactly how much revenue is generated for every dollar spent on advertising, while also factoring in broader influences like GDP growth or shifts in consumer confidence [28].
Reliability of Historical Data
To get accurate forecasts, multi-variable regression relies on 12 to 24 months of clean, detailed historical data that includes all relevant variables [13]. Often, the method uses "lagged" values - data from previous periods - to predict future sales. Ensuring the dataset is clean and complete is critical because missing data or outliers can throw off results. Before diving into regression, the data must meet statistical assumptions like linearity, constant variance, and independence of errors. A well-prepared dataset is the foundation for reliable analysis [28].
Impact on Forecast Accuracy
This data-driven approach helps businesses pinpoint which factors have the biggest impact on revenue. By measuring how variables like marketing spend or economic indicators influence sales, companies can improve forecast accuracy. Metrics such as R-squared (explaining variance), Mean Absolute Error (MAE), and Root Mean Squared Error (RMSE) are often used to assess the model's performance. Interestingly, businesses using data-driven forecasting grow 19% faster than those relying solely on intuition [16]. A common best practice is to split historical data into an 80/20 ratio - 80% for training the model and 20% for validation - to ensure predictions are reliable [29].
Ease of Implementation and Scalability
Multi-variable regression is more intricate than simple models because it factors in multiple predictors at once [28]. Managing large datasets often requires specialized tools like Python's statsmodels or R, along with statistical expertise to address challenges like multicollinearity. This occurs when predictors are highly correlated, leading to unstable estimates [28]. As organizations grow, many shift from manual processes to dedicated Revenue Operations teams equipped with advanced software to streamline regression analyses [4] [5]. For particularly large or non-linear datasets, traditional regression may fall short, prompting the use of machine learning models like Random Forests or Neural Networks, which handle complex interactions more effectively [29] [30]. Tools like Coach Pilot can help sales teams turn these regression insights into actionable strategies, improving pipeline management and execution. These insights also allow for continuous refinement of forecasts by addressing historical errors over time.
5. Forecast Calibration Through Historical Error Analysis
Forecast calibration takes forecasting a step further by learning from past mistakes. It’s all about adjusting future projections based on how previous forecasts measured up against actual results [8]. Instead of just identifying inaccuracies, this approach uses those insights to refine future predictions. And it’s needed - 79% of sales organizations miss their forecasts by more than 10%, and fewer than half of sales leaders trust their own projections [8].
Impact on Forecast Accuracy
Historical error analysis often exposes recurring biases in forecasting. For instance, teams may have an "optimism bias" (overestimating results) or engage in "sandbagging" (intentionally underestimating) [8][15]. To address these patterns, teams can calculate a calibration factor - divide actual revenue by the forecasted pipeline.
Here’s a real-world example: A B2B sales team reviewed six months of data and found they consistently over-forecasted. Their average pipeline forecast was $200,000, but their actual closed-won revenue came in at $160,000 - a 25% overestimation. By applying a calibration factor of 0.8 to their $184,000 weighted forecast, they arrived at a more accurate projection of $147,200 [3].
The payoff for this kind of adjustment is clear. Companies that regularly review forecast accuracy tend to see 15% better sales performance. Plus, those with reliable forecasts are 10% more likely to grow their revenue year-over-year [8][10]. Refining forecasts also helps maintain high-quality data, which is critical to making calibration effective.
Reliability of Historical Data
Calibration only works if the data it’s based on is trustworthy. As Alex Zlotko, CEO at Forecastio, puts it:
bad data creates a 'Butterfly Effect' where small initial errors in deal amounts or dates lead to massive forecast disasters downstream
[15]. Regular monthly audits are essential to catch issues like "Ghost Deals" (missing amounts) or "Timeless Wonders" (missing close dates), which can throw off error analysis.
Ease of Implementation and Scalability
For small teams, calculating a basic calibration factor over six months is manageable, though it might take up to 10 hours a week and still miss 60% of issues [15]. Larger organizations, however, benefit from automation. AI-powered tools can cut manual effort to under an hour a week while catching over 95% of data problems [15].
Metrics like Mean Absolute Percentage Error (MAPE) for steady revenue streams or Symmetric MAPE (sMAPE) for more unpredictable pipelines can help quantify errors. Weekly reviews allow teams to spot deviations early and adjust their calibrations as needed [8][10]. Tools like Coach Pilot even translate these insights into actionable coaching, helping sales reps understand how their pipeline management impacts forecast accuracy.
Best Practices for Using Historical Data
When relying on historical data for sales forecasting, maintaining high-quality data is non-negotiable. Accurate forecasts depend on data that is clean, up-to-date, and complete. Without these elements, even the most sophisticated forecasting models can fall short.
One of the first steps is standardizing CRM inputs. Make key fields like deal amount, close date, and pipeline stage mandatory. This prevents small errors from snowballing over time. A great example of this is Atlassian. In 2022, they addressed missing data in 20% of their opportunities. By implementing mandatory fields and automated monitoring, they boosted forecast accuracy from 65% to 87% in just two quarters. Additionally, they reduced their sales cycle by 12 days - a win-win for both accuracy and efficiency[15].
Regular pipeline cleaning is another critical practice. Use the 30-Day Rule: flag any opportunity with no activity for 30 days or more. These deals are 80% less likely to close, so identifying them early is key[10]. Establish a structured review process, such as weekly pipeline reviews to catch immediate errors, monthly audits to address recurring issues, and quarterly deep cleans to eliminate outdated opportunities. Modern AI tools make this process even more efficient, identifying over 95% of problems in under an hour[15].
Platforms like Coach Pilot take this a step further by combining historical data analysis with AI-driven sales coaching. These tools provide real-time guidance to sales reps, helping them maintain pipeline hygiene and improve deal management. By embedding these insights into everyday workflows, teams can ensure their data stays accurate while fostering better forecasting habits. Companies with precise sales forecasts are 10% more likely to grow revenue year-over-year and 7% more likely to meet their quotas[10].
Ultimately, data quality isn’t a one-time effort - it’s an ongoing commitment. Poor data doesn’t just lead to inaccurate forecasts; it also erodes trust within the organization. By integrating strict performance metrics and clear pipeline criteria, businesses can reinforce reliable forecasts that directly support revenue growth.
Conclusion
Historical data lays the groundwork for reliable forecasting. The five methods discussed turn past performance into insights you can act on. Time series analysis helps identify recurring seasonal trends. Historical run-rate forecasting offers a dependable baseline for businesses with steady revenue patterns. Consumption-based forecasting cuts through the noise in subscription models to uncover genuine trends. Multi-variable regression links your efforts - like marketing investments or pricing adjustments - to measurable outcomes. Lastly, forecast calibration through error analysis ensures you learn from past inaccuracies to improve future predictions.
Consider this: only 43% of sales organizations achieve forecasts within a 10% margin of accuracy[6]. Yet, companies that excel in forecasting are 10% more likely to grow revenue year-over-year and 7% more likely to meet quotas[10]. High-performing teams routinely hit 85% to 95% forecast accuracy[10], proving that precision is attainable when historical data is used effectively. These stats highlight the importance of a data-driven approach to forecasting.
"Forecasting is not about perfection but about providing a unified, data-based outlook on future performance." - Alex Thompson, Sales & Revenue Growth Expert[13]
This sentiment emphasizes the importance of tools that combine historical data with real-time insights. Platforms like Coach Pilot illustrate this by integrating historical analysis with AI-powered sales coaching directly into workflows. This approach not only improves pipeline management but also enhances forecast accuracy. By merging actionable data with real-time guidance, teams can create a feedback loop that boosts both individual and organizational performance.
Start now. These five methods provide a framework to turn historical data into actionable forecasts. Clean up your pipeline, standardize your processes, and choose the method that best suits your business. Shifting from guesswork to data-driven forecasting enhances strategic planning, resource allocation, and overall confidence in your decisions.
FAQs
How much historical data do I need for accurate forecasts?
When determining how much historical data to use, it’s all about finding the right balance for your business and forecasting objectives. If you rely on too little data, you risk overlooking important trends. On the other hand, using an excessive amount could result in overfitting or basing decisions on outdated information. The key is to select a dataset that’s both relevant and properly sized to identify meaningful patterns while maintaining accuracy.
Which forecasting method fits my business model best?
The best forecasting method for your business hinges on factors like the complexity of your sales cycle, the data you have on hand, and how precise your predictions need to be. If your sales follow a steady, predictable pattern, straightforward techniques like trend analysis or moving averages can do the job effectively. However, if your sales environment is more dynamic or involves intricate variables, advanced tools such as AI-driven models or machine learning might yield more accurate insights. Take a close look at your data's quality and your sales cycle's complexity to determine which approach fits your needs best.
How do I clean CRM data without losing important deals?
Keeping your CRM data in good shape isn’t about a one-time cleanup - it’s about consistent upkeep. To ensure your data stays reliable, focus on these essential practices:
Eliminate duplicates: Regularly check for and remove duplicate records to avoid confusion and errors.
Validate contact details: Ensure phone numbers, email addresses, and other contact information are accurate and up to date.
Organize accounts effectively: Group and categorize accounts properly so your team can access the right information quickly.
Avoid relying on manual fixes or shortcuts - they often lead to mistakes that could cost you valuable deals. Instead, set up structured processes with clear ownership and measurable KPIs. This way, you can protect your data from decay and safeguard critical business opportunities. Consistency is key!
Related Blog Posts

Remove the guesswork from winning more deals.
